
Validation Case Study – Resource Allocation
Summary
This table summarizes the differences in forecasting accuracy between PBE’s models and the naïve models across the 118 cells. The table shows the weighted-average absolute percent errors for both models. Scripts were used to weight the errors for each cell.
PBE was able to reduce the naïve model error by 75% . We have undertaken a total of 14 such validation exercises and have in each case reduced the naïve model error by 75% to 85%. In other words, this Case Study is far from our best example. As of this writing, we are aware of no one else being able to reduce the naïve model error at all, much less challenge PBE’s standards.
Forecast vs. Actual Filled Rx’s Weighted-Average of 118 Cells
| PBE Models 3.1% |
Naïve Models 12.4% |
A Blinded Forecasting Test To Objectively Determine if it is
Possible to Quantify the Relationship Between Amounts of
Details/Samples and Rx’s at the Individual Doctor Level
Call Value Targeting
Introduction
Pharmaceutical companies are constantly focused on improving the productivity of their detailing and sampling. This is not surprising, since an organization’s sales force is normally its second largest expense item after R & D. Additionally, details and samples are such potent generators of Rx’s that the opportunity cost of failing to fully exploit their potential is enormous.
Companies are increasingly relying on mathematical models that their creators claim quantify the relationship between details and samples on the one hand and filled Rx’s on the other, for each individual doctor. In theory, such models could show how 1,000 representatives might detail and sample with the effectiveness of 1,200 or more — without making more calls.
However, there is a question every user of models should want answered: “Do these models really do what they claim to do?” How does a company know if its models actually quantify the cause and effect of personal selling? Specifically, do the models quantify cause and effect well enough so that, if representatives follow the resulting plans, they will be more productive than they would have been on their own?
In order to determine if anyone could actually quantify cause and effect, an interested party sponsored a shoot out among organizations that claim to be able to forecast at the doctor level. The test was designed to determine if anyone could backup their claim. Five organizations agreed, including PBE, and one later dropped out. Other invitees declined to participate from the outset.
PBE won the shoot-out “hands down”. According to the sponsor, none of the other participants was able to account for the impact of details and samples at all! The Validation Methodology Section of this Case Study explains how the sponsor reached these conclusions. In short, they created a placebo.
The sponsor of the shoot-out has released very little detailed information. However, the Case Study that follows presents highly detailed information from a blinded validation test conducted by a leading pharmaceutical company. This exercise involved only PBE, but the protocol was the same as in the shoot-out. This protocol (which was reviewed by a leading academic) enables any company to quickly determine if and how well a model building methodology finds the relationship between numbers of details and samples on one hand and total filled Rx’s on the other at the individual doctor level for an established brand.
Validation Methodology
A pharmaceutical company provided PBE with monthly, doctor-level detailing and sampling data for 30 consecutive months for one of its brands. The company also provided the corresponding doctor-level prescribing data for only the first 24 of those months. PBE’s mission was to tell the company how many Rx’s each doctor had had filled during the remaining six months that were withheld from PBE. This way, the company was able to immediately validate PBE’s forecasts for each doctor by comparing them to the actual audited Rx’s for these same doctors. By taking advantage of existing data, the company was able to avoid the time and expense of a test market – which would also have forced representatives to adhere strictly to specific call plans.
For purposes of analysis, the doctors were grouped into 120 cells. This was done by segmenting the doctors by 12 levels of market share and 10 levels of prescribing volume. Forecasts were made for each doctor within each cell and these forecasts were then summed to produce a single forecast for each cell. The absolute percent difference between forecasted Rx’s and actual Rx’s was calculated for each cell.
The doctors were grouped into 120 cells for two reasons. First, although 120 numbers are a lot to look at, this is far better than looking at forecasts for tens of thousands of doctors. Second, there is a tremendous amount of random variation in the number of scripts individual doctors write for a brand from one period to the next. This variation is primarily due to the luck of the draw in terms of the number of patients showing up in the office that the doctor considers to be appropriate for a specific drug. Grouping the doctors eliminates most of the effect of this random variation.
Prior to the exercise, it was agreed that the accuracy of PBE’s forecasts would be compared to the accuracy of forecasts produced by a naïve model, i.e., the placebo. The naïve model simply stated that each doctor’s filled Rx’s would increase at the national rate. In this case, Rx’s were flat, so the naïve model assumed that each and every doctor’s prescribing would remain constant.
The naïve model assumes, in effect, that detailing and sampling have no impact on filled Rx’s. Both the client and PBE agreed that any methodology that cannot at least beat the naïve model is worthless at best — and counter-productive at worst.
The sponsor of the shoot-out used this naïve model to determine that PBE had indeed quantified the cause and effect of personal selling which none of the other participants was able to do.
TABLES 1- 4
These tables show the period-to-period changes in detailing and sampling for the brand used in the exercise. PBE has had the opportunity to examine the detailing and sampling of scores of brands. We have consistently observed that there is a large amount of period-to-period variation in detailing and sampling at the individual doctor level even when the national numbers are stable. Such was the case with this brand.
This variation in promotion at the doctor level makes the validation protocol discussed earlier a true test of someone’s ability to model cause and effect well enough to create plans that find hidden profits.
Tables 1, 2, 3 compare detailing activities (Primary, Secondary and Reminder) during the forecasted six months (Period 2) versus the previous six months (Period 1) for every doctor who wrote a script or received promotion during either period. For example, Table 1 shows that 3,939 doctors received exactly three Primary Details during Period 1. (This number is shown in the far right column.) Looking across the corresponding row, one sees that of the 3,939 doctors who received 3 primary details in Period 1 — 1,807 were not detailed at all during Period 2. In fact, fewer than 10% (298) of the doctors who received three primary details during Period 1 received that exact same number in Period 2.
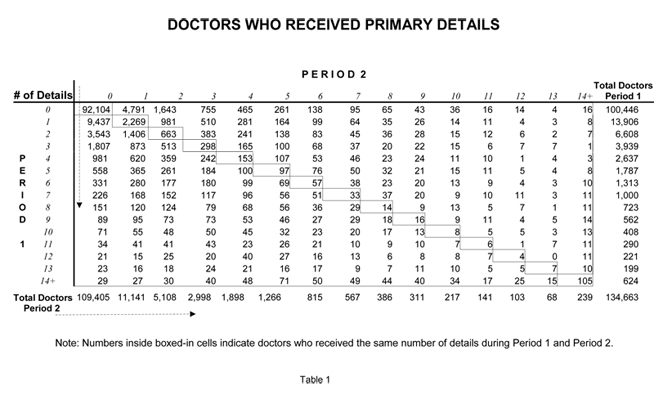
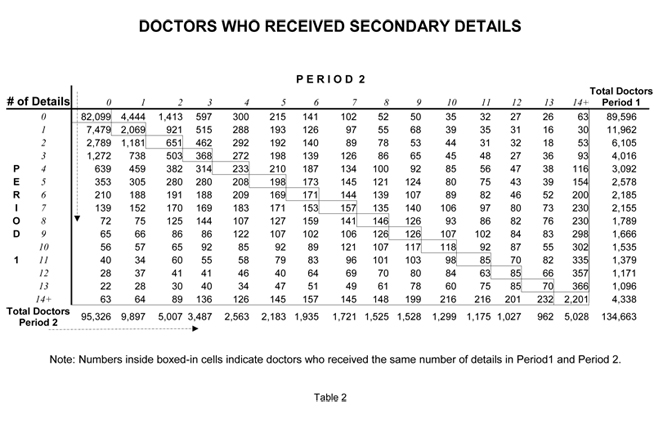
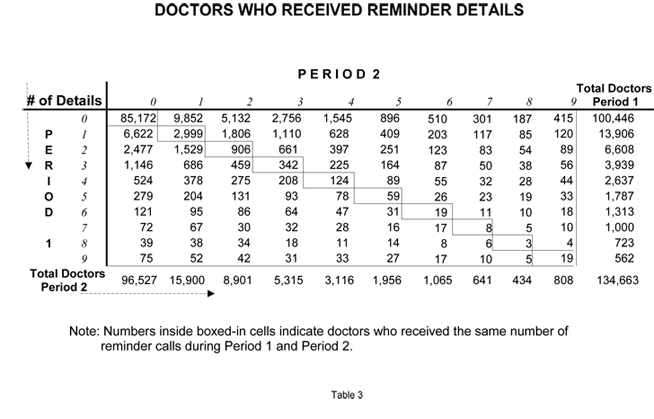
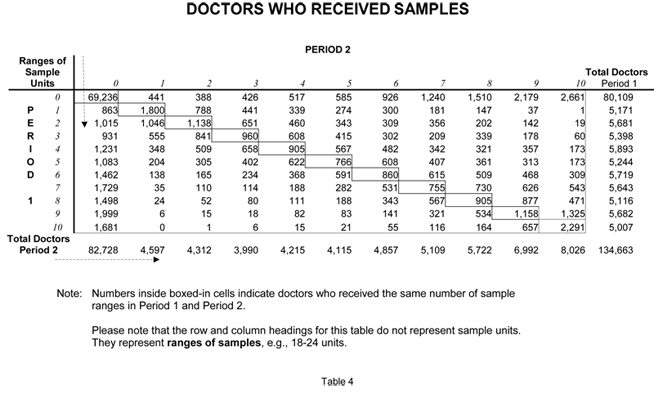
TABLE 5
This table shows the results of PBE’s forecasts versus the naïve model forecasts. For purposes of the exercise, the doctors were grouped 12 ways according to their initial shares and 10 ways according to their prescribing volumes. We then added all the forecasts for doctors within each cell to produce 118 forecasts (2 cells were empty) rather than 134,000 forecasts. The data were looked at the cell level for two reasons. First, grouping the doctors into cells greatly reduces the impact of random variation created by patient visits. Second, aggregating the data makes it much easier to see what was going on.
Here is how to read the table, starting by reading across the first line on Table 5 (CELL 1). This cell has the doctors in the lowest share and volume groups – Group I in both cases. There were 2,404 doctors in this cell and they wrote a total of 2,404 scripts during Period 1. During Period 2, the forecasted period, their scripts jumped to 12,549. PBE had predicted 12,626. PBE’s forecast was off by 0.06%. The naïve model (Period 1 vs. Period 2) which assumed no change, was off by 80%.
| Results of PBE’s Forecasts vs. Naïve Model Forecasts | ||||||||
| Actual Rx’s | Actual Rx’s | Predicted Rx’s | PBE Error | Naïve Error | ||||
| Cell | Share Group |
Volume Group |
Freq | Period 1 | Period 2 | Period 2 | Predicted vs.Actual | Period 1 vs.Period 2 |
| 1 | 1 | 1 | 2404 | 2404 | 12549 | 12626 | 0.00613 | 0.80843 |
| 2 | 1 | 2 | 1659 | 3904 | 13352 | 12640 | 0.05331 | 0.70763 |
| 3 | 1 | 3 | 596 | 2611 | 6574 | 6810 | 0.03599 | 0.60281 |
| 4 | 1 | 4 | 408 | 2743 | 5611 | 5878 | 0.04756 | 0.51113 |
| 5 | 1 | 5 | 245 | 2393 | 4466 | 4197 | 0.06029 | 0.46421 |
| 6 | 1 | 6 | 236 | 3340 | 5045 | 5590 | 0.10811 | 0.33793 |
| 7 | 1 | 7 | 178 | 3927 | 5425 | 5069 | 0.06565 | 0.27613 |
| 8 | 1 | 8 | 107 | 3790 | 5294 | 4742 | 0.10421 | 0.28409 |
| 9 | 1 | 9 | 25 | 1414 | 1734 | 1393 | 0.19689 | 0.18454 |
| 10 | 1 | 10 | 5 | 460 | 516 | 388 | 0.24736 | 0.10853 |
| 11 | 2 | 1 | 1865 | 1865 | 6307 | 6762 | 0.07215 | 0.70432 |
| 12 | 2 | 2 | 2248 | 5436 | 13623 | 13594 | 0.00215 | 0.60099 |
| 13 | 2 | 3 | 1328 | 5887 | 11813 | 11094 | 0.06082 | 0.50163 |
| 14 | 2 | 4 | 1292 | 8863 | 14859 | 14226 | 0.04260 | 0.40353 |
| 15 | 2 | 5 | 868 | 8580 | 13165 | 13516 | 0.02670 | 0.34826 |
| 16 | 2 | 6 | 923 | 13063 | 18757 | 17485 | 0.06781 | 0.30356 |
| 17 | 2 | 7 | 846 | 18681 | 23953 | 23004 | 0.03959 | 0.22008 |
| 18 | 2 | 8 | 898 | 32204 | 39452 | 37278 | 0.05511 | 0.18371 |
| 19 | 2 | 9 | 671 | 40776 | 45465 | 43848 | 0.03557 | 0.10313 |
| 20 | 2 | 10 | 298 | 33128 | 35724 | 33806 | 0.05368 | 0.07266 |
| 21 | 3 | 1 | 998 | 998 | 2819 | 3015 | 0.06938 | 0.64602 |
| 22 | 3 | 2 | 1745 | 4258 | 8620 | 8980 | 0.04170 | 0.50607 |
| 23 | 3 | 3 | 1209 | 5362 | 8810 | 8241 | 0.06464 | 0.39138 |
| 24 | 3 | 4 | 1450 | 10080 | 14061 | 15698 | 0.11643 | 0.28308 |
| 25 | 3 | 5 | 1068 | 10582 | 13991 | 13659 | 0.02374 | 0.24366 |
| 26 | 3 | 6 | 1399 | 19932 | 25147 | 24842 | 0.01213 | 0.20740 |
| 27 | 3 | 7 | 1237 | 27294 | 31880 | 32440 | 0.01758 | 0.14384 |
| 28 | 3 | 8 | 1299 | 47023 | 53566 | 52420 | 0.02139 | 0.12215 |
| 29 | 3 | 9 | 1372 | 84595 | 90745 | 87971 | 0.03057 | 0.06778 |
| 30 | 3 | 10 | 1417 | 180655 | 185594 | 178636 | 0.03750 | 0.02662 |
| 31 | 4 | 1 | 948 | 948 | 2354 | 2586 | 0.09867 | 0.59726 |
| 32 | 4 | 2 | 1308 | 3192 | 5928 | 5870 | 0.00971 | 0.46161 |
| 33 | 4 | 3 | 1021 | 4544 | 6342 | 6729 | 0.06101 | 0.28348 |
| 34 | 4 | 4 | 1371 | 9570 | 11361 | 11604 | 0.02136 | 0.15772 |
| 35 | 4 | 5 | 1033 | 10193 | 12157 | 12310 | 0.01258 | 0.16161 |
| 36 | 4 | 6 | 1387 | 19842 | 22829 | 22421 | 0.01786 | 0.13081 |
| 37 | 4 | 7 | 1470 | 32283 | 35298 | 33460 | 0.05206 | 0.08542 |
| 38 | 4 | 8 | 1467 | 52945 | 56969 | 53180 | 0.06651 | 0.07063 |
| 39 | 4 | 9 | 1429 | 88134 | 91007 | 84928 | 0.06680 | 0.03158 |
| 40 | 4 | 10 | 2237 | 328011 | 323316 | 311589 | 0.03627 | 0.01452 |
| 41 | 5 | 1 | 588 | 588 | 1149 | 1538 | 0.33828 | 0.48823 |
| 42 | 5 | 2 | 951 | 2326 | 4082 | 3697 | 0.09436 | 0.43010 |
| 43 | 5 | 3 | 812 | 3602 | 4776 | 5141 | 0.07633 | 0.24583 |
| 44 | 5 | 4 | 1146 | 8028 | 8928 | 10088 | 0.12989 | 0.10089 |
| 45 | 5 | 5 | 949 | 9407 | 10023 | 11298 | 0.12715 | 0.06145 |
| 46 | 5 | 6 | 1310 | 18850 | 19577 | 21193 | 0.08257 | 0.03714 |
| 47 | 5 | 7 | 1392 | 30751 | 31044 | 30838 | 0.00664 | 0.00946 |
| 48 | 5 | 8 | 1514 | 54428 | 53871 | 53045 | 0.01534 | 0.01034 |
| 49 | 5 | 9 | 1321 | 80697 | 78533 | 75885 | 0.03373 | 0.02755 |
| 50 | 5 | 10 | 2280 | 376893 | 358270 | 347064 | 0.03128 | 0.05198 |
| 51 | 6 | 1 | 323 | 323 | 576 | 720 | 0.25070 | 0.43915 |
| 52 | 6 | 2 | 743 | 1878 | 2918 | 3118 | 0.06875 | 0.35625 |
| 53 | 6 | 3 | 604 | 2697 | 3171 | 2977 | 0.06114 | 0.14952 |
| 54 | 6 | 4 | 866 | 6006 | 6543 | 6878 | 0.05122 | 0.08206 |
| 55 | 6 | 5 | 682 | 6759 | 6702 | 7040 | 0.05047 | 0.00855 |
| 56 | 6 | 6 | 1114 | 16037 | 17102 | 16828 | 0.01602 | 0.06227 |
| 57 | 6 | 7 | 1242 | 27607 | 26499 | 26773 | 0.01031 | 0.04181 |
| 58 | 6 | 8 | 1248 | 44517 | 42100 | 41535 | 0.01343 | 0.05742 |
| 59 | 6 | 9 | 985 | 59863 | 55760 | 54668 | 0.01957 | 0.07359 |
| 60 | 6 | 10 | 1937 | 354250 | 332732 | 320256 | 0.03750 | 0.06467 |
| 61 | 7 | 1 | 752 | 752 | 1449 | 1393 | 0.03892 | 0.48106 |
| 62 | 7 | 2 | 1376 | 3322 | 4773 | 4479 | 0.06169 | 0.30412 |
| 63 | 7 | 3 | 1107 | 4939 | 5542 | 6121 | 0.10447 | 0.10867 |
| 64 | 7 | 4 | 1456 | 10156 | 9492 | 10310 | 0.08621 | 0.06995 |
| 65 | 7 | 5 | 1196 | 11830 | 10892 | 11489 | 0.05479 | 0.08609 |
| 66 | 7 | 6 | 1817 | 26007 | 23952 | 25236 | 0.05363 | 0.08580 |
| 67 | 7 | 7 | 1958 | 43195 | 38686 | 39996 | 0.03386 | 0.11656 |
| 68 | 7 | 8 | 2025 | 72930 | 65817 | 65655 | 0.00246 | 0.10809 |
| 69 | 7 | 9 | 1651 | 101016 | 93518 | 90301 | 0.03439 | 0.08019 |
| 70 | 7 | 10 | 2696 | 523590 | 488898 | 475539 | 0.02732 | 0.07096 |
| 71 | 8 | 1 | 450 | 450 | 763 | 710 | 0.06958 | 0.41038 |
| 72 | 8 | 2 | 1422 | 3591 | 4257 | 4306 | 0.01136 | 0.15665 |
| 73 | 8 | 3 | 1333 | 5941 | 5475 | 5587 | 0.02045 | 0.08522 |
| 74 | 8 | 4 | 1773 | 12386 | 10753 | 10870 | 0.01088 | 0.15185 |
| 75 | 8 | 5 | 1460 | 14390 | 11591 | 11949 | 0.03086 | 0.24147 |
| 76 | 8 | 6 | 1962 | 28239 | 23687 | 25043 | 0.05724 | 0.19216 |
| 77 | 8 | 7 | 2205 | 48433 | 41165 | 41708 | 0.01318 | 0.17655 |
| 78 | 8 | 8 | 2258 | 80507 | 66902 | 68912 | 0.03004 | 0.20335 |
| 79 | 8 | 9 | 1682 | 101828 | 89116 | 87985 | 0.01268 | 0.14265 |
| 80 | 8 | 10 | 2684 | 588252 | 538877 | 525613 | 0.02461 | 0.09163 |
| 81 | 9 | 1 | 1220 | 1220 | 1774 | 2230 | 0.25722 | 0.31224 |
| 82 | 9 | 2 | 1658 | 4065 | 4445 | 4488 | 0.00970 | 0.08542 |
| 83 | 9 | 3 | 1520 | 6714 | 5556 | 5204 | 0.06320 | 0.20848 |
| 84 | 9 | 4 | 2100 | 14620 | 10620 | 10466 | 0.01444 | 0.37671 |
| 85 | 9 | 5 | 1454 | 14307 | 10565 | 10696 | 0.01239 | 0.35425 |
| 86 | 9 | 6 | 1864 | 26569 | 19885 | 20219 | 0.01678 | 0.33615 |
| 87 | 9 | 7 | 1718 | 37746 | 28869 | 29031 | 0.00559 | 0.30749 |
| 88 | 9 | 8 | 1630 | 58176 | 47091 | 47927 | 0.01776 | 0.23541 |
| 89 | 9 | 9 | 1179 | 71621 | 58923 | 58759 | 0.00278 | 0.21550 |
| 90 | 9 | 10 | 1540 | 358936 | 324675 | 324880 | 0.00063 | 0.10552 |
| 91 | 10 | 2 | 629 | 1481 | 1313 | 1141 | 0.13081 | 0.12841 |
| 92 | 10 | 3 | 589 | 2588 | 2035 | 1812 | 0.10941 | 0.27178 |
| 93 | 10 | 4 | 892 | 6154 | 3683 | 3700 | 0.00460 | 0.67086 |
| 94 | 10 | 5 | 624 | 6164 | 3609 | 3776 | 0.04633 | 0.70781 |
| 95 | 10 | 6 | 739 | 10548 | 7091 | 6276 | 0.11485 | 0.48755 |
| 96 | 10 | 7 | 587 | 12802 | 8734 | 9170 | 0.04994 | 0.46576 |
| 97 | 10 | 8 | 445 | 15980 | 11442 | 11588 | 0.01276 | 0.39662 |
| 98 | 10 | 9 | 281 | 16966 | 14729 | 13045 | 0.11430 | 0.15188 |
| 99 | 10 | 10 | 282 | 54733 | 46965 | 45232 | 0.03690 | 0.16540 |
| 100 | 11 | 2 | 264 | 792 | 662 | 595 | 0.10088 | 0.19617 |
| 101 | 11 | 3 | 514 | 2349 | 1325 | 1244 | 0.06129 | 0.77269 |
| 102 | 11 | 4 | 716 | 4998 | 2854 | 2879 | 0.00878 | 0.75113 |
| 103 | 11 | 5 | 390 | 3807 | 2135 | 2233 | 0.04585 | 0.78334 |
| 104 | 11 | 6 | 403 | 5711 | 3187 | 3445 | 0.08106 | 0.79198 |
| 105 | 11 | 7 | 257 | 5596 | 3443 | 3389 | 0.01582 | 0.62529 |
| 106 | 11 | 8 | 153 | 5310 | 3869 | 3973 | 0.02681 | 0.37243 |
| 107 | 11 | 9 | 70 | 4137 | 3774 | 3331 | 0.11735 | 0.09619 |
| 108 | 11 | 10 | 39 | 7842 | 5948 | 6804 | 0.14386 | 0.31843 |
| 109 | 12 | 1 | 2986 | 2986 | 3443 | 3270 | 0.05030 | 0.13270 |
| 110 | 12 | 2 | 3434 | 8197 | 5872 | 5659 | 0.03626 | 0.39591 |
| 111 | 12 | 3 | 1854 | 8109 | 4411 | 4379 | 0.00715 | 0.83859 |
| 112 | 12 | 4 | 1710 | 11724 | 5267 | 5292 | 0.00487 | 1.22597 |
| 113 | 12 | 5 | 823 | 8063 | 3929 | 3927 | 0.00063 | 1.05216 |
| 114 | 12 | 6 | 591 | 8127 | 3822 | 3813 | 0.00247 | 1.12633 |
| 115 | 12 | 7 | 186 | 3935 | 2012 | 2099 | 0.04308 | 0.95581 |
| 116 | 12 | 8 | 68 | 2288 | 1222 | 1396 | 0.14251 | 0.87229 |
| 117 | 12 | 9 | 14 | 830 | 603 | 540 | 0.10473 | 0.37647 |
| 118 | 12 | 10 | 5 | 822 | 685 | 710 | 0.03591 | 0.20000 |